Allele Similarity Cluster (ASC)
The term Allele similarity clusters (ASC), defines alleles that have a degree of germline proximity. The proximity is defined as the Levenshtein distance between the coding region of the alleles’ germline sequences. A distance matrix of all alleles’ Levenshtein distance is constructed and the hierarchical tree is calculated. The tree leaves are then clustered by 95% similarity which creates the alleles clusters.
This IGH reference book uses the current IMGT IGHV reference available. We selected functional alleles and trimmed the sequences up to position 318. We discarded alleles which are truncated in their 5’ region as well as those that are less then 318 nucleotides.
Library amplicon length
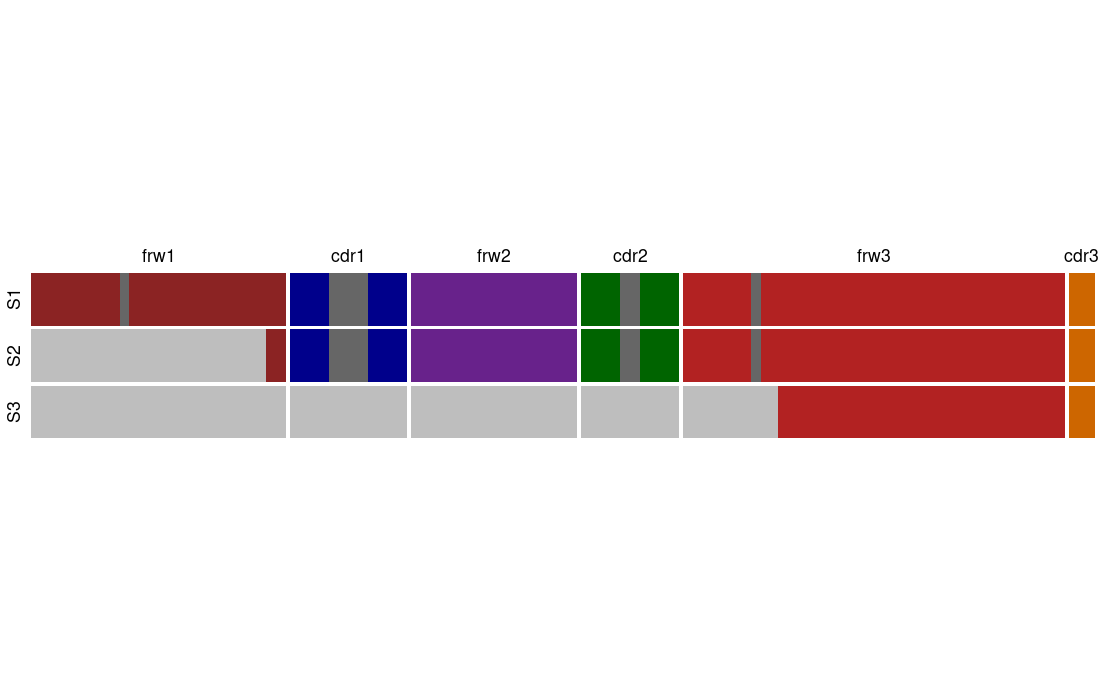
Even though, we wish that all repertoires data available will cover the entire V region this is not always the case. Hence, we adapted our protocols to fit partial V coverage libraries. For the beginning we chose two library amplicon length, BIOMED-2 primers and Adaptive region coverage. The table below summaries the naming for each of the amplicon lengths and see Figure 1 for coverage illustration:
| Library amplicon length | Coverage | Similar known protocol |
|---|---|---|
| S1 | Full length - 1 to 318 (IMGT numbering) | 5’ Race |
| S2 | Starting within the framework 1 region | BIOMED-2 |
| S3 | End of the V region | Adaptive |

Genes to allele clusters
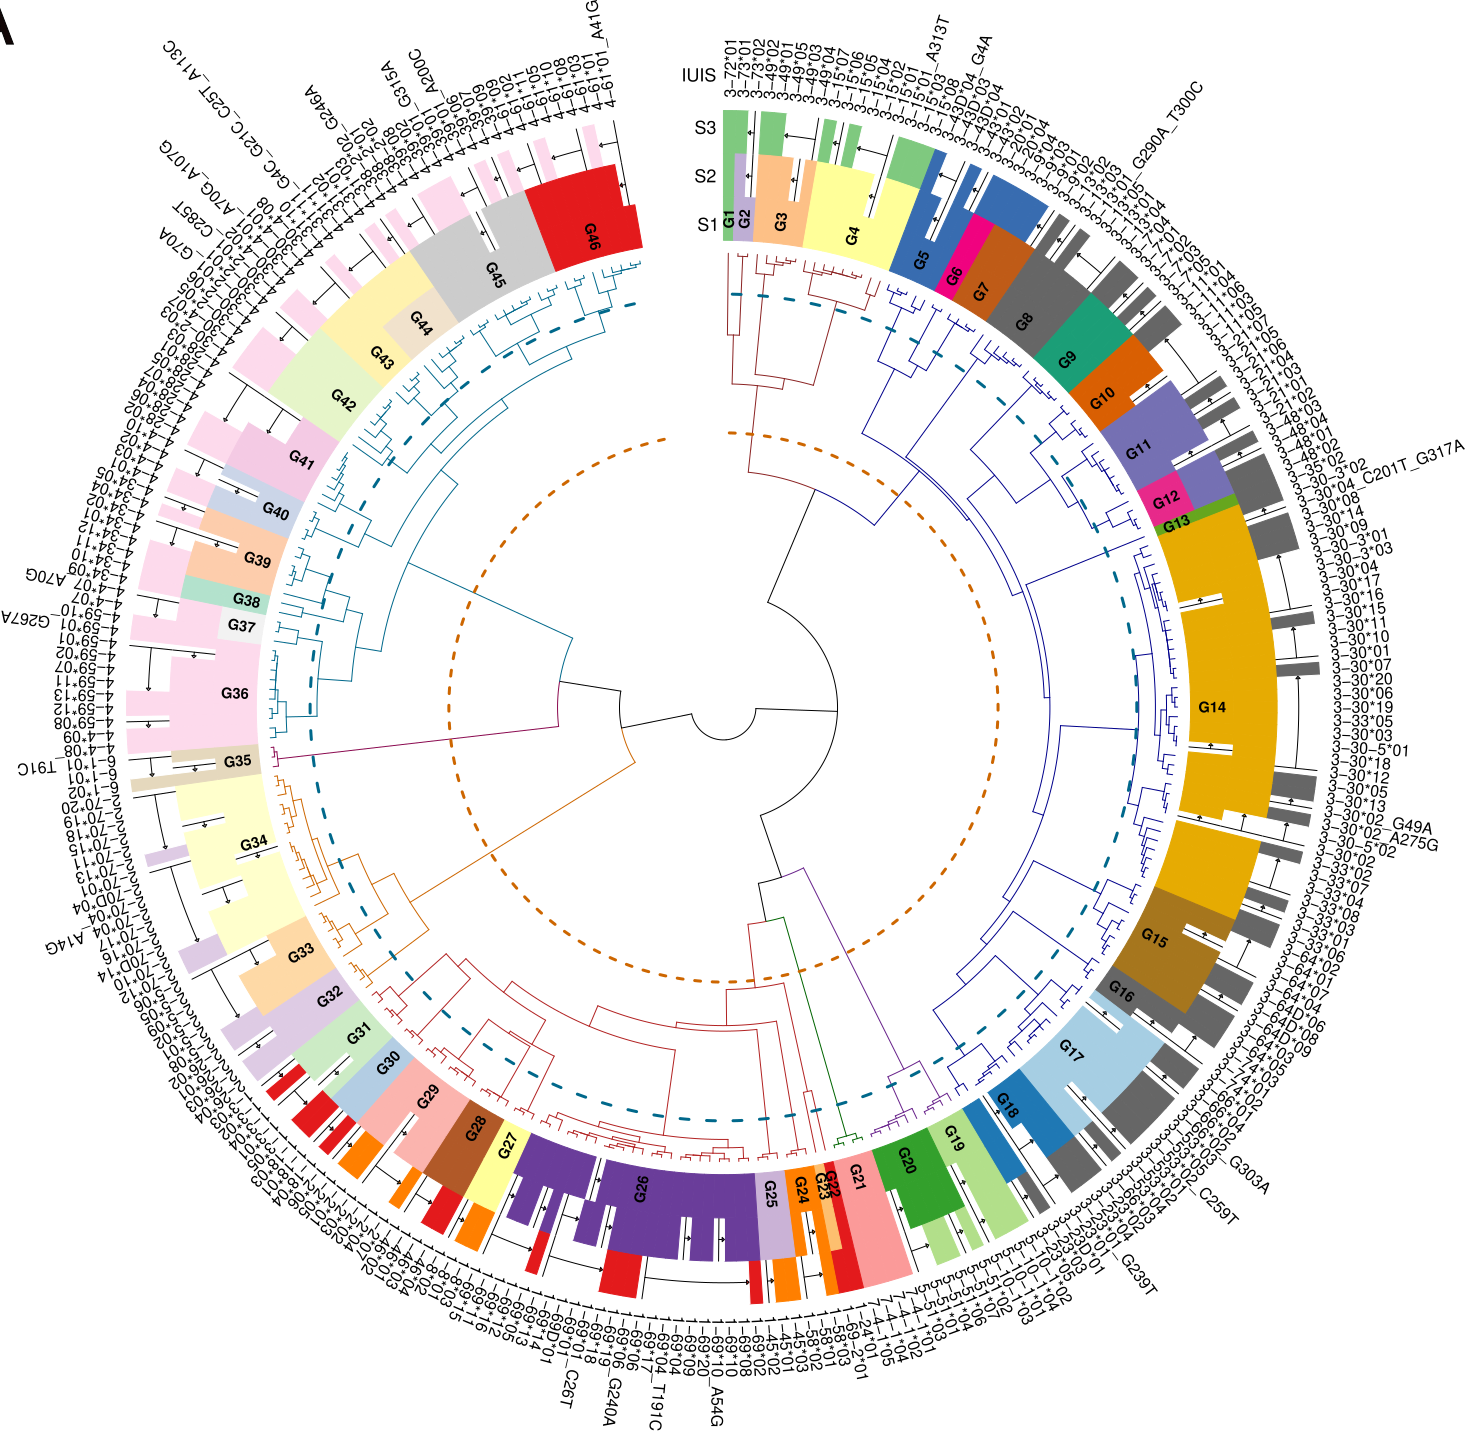
To illustrate the relation between the International Union of Immunological Societies (IUIS) and IMGT (Giudicelli and Lefranc 1999) named alleles to the clustered allele clusters we created the figure Figure 2.

Alleles’ group summary
| Length | Family | Group | Alleles |
|---|---|---|---|
| IUIS/IMGT | 7 | 54 | 286 |
| S1 | 8 | 47 | 279 |
| S2 | 44 | 247 | |
| S3 | 11 | 130 |
Creating ASC based on reference set
The application below demonstrates the creation of the ASCs based on a given reference set. Either use the example human IGH reference set within the app, or upload a reference set of your own. The application includes four tabs; 1. The ASCs allele table, the columns are described below: - imgt_allele - the original IUIS/IMGT allele name - alleles_family - the ASC cluster number - alleles_group - the ASC cluster number - new_allele - the ASC given allele name - duplicated - if the allele has a duplicated allele within the set 2. An MDS plot of the input germline reference set. The two axis are the first components. Each dot in the plot is an allele. The colors of the dots are by the original genes (if present in the allele name). 3. ASC cluster plot - shows the hierarchical clustering of the input germline reference set. The out most circle is the allele names, the second layer are the ASC groups, each group is labeled and colored. The third circle is the clustering dendrogram, the braches are colored by the ASC families. The blue and orange dashed lines are the 95% and 75% similarity ASC threshold. 4. ASC match plot - shows the matching btween the IUIS/IMGT genes and the ASC clusters.
References